
 The Concentrated Solar Power Industry continues to hold capital cost information close to its chest.
 The construction of a 400 megawatt BrightSource solar thermal plant in Ivanpah, Calif. will result in $3 billion in direct investment into the economy, the companies saidWhat does a 3 billion dollar direct investment into the economy mean? Chances are three billion dollars represent overnight costs. That would mean a cost with interest of between $5 and $6 billion. If we assume the lower figure, that would mean an investment of about $12.50 per watt. In contrast nuclear plant investments were estimated to run at $7.00 per watt, and renewables spokesperson Joe Romm describe the cost of nuclear facilities as outrageous.
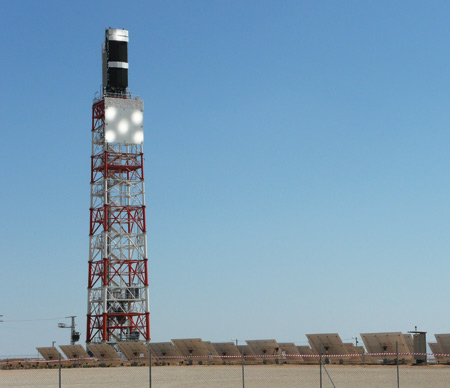
Brightsource plans to expand the Ivanpath facility to 1300 MWs, and reports that the expanded facility will produce about 3.7 billion kWhs of electricity per year. One way of judging how well a plant fulfills its potential is to measure its capacity factor, A typical nuclear facility will have acapacity factor of over .90. The Ivanpath solar facility will have a capacity factor of ,325. That means that for every 3 watts pf electricity a large reactor will produce, the Ivanpath CSP facility will produce a little better than 1. So how much would it cost to produce the same amount of electricity with CSP as would be produced by a typical reactor? The answer would run between $30 and $35 billion.


2 comments:
It is important to recognize that Renewables Proponents like to either ignore capacity factor or when they consider it they use the environmental capacity factor - i.e. Wind Chart data or Solar PV data, and then pretend it's the same thing as capacity factor for Nuclear, Hydro or Coal. Not true. Nukes and Coal Plants are shutdown when demand is low, i.e. spring or fall, for maintenance. They have predictable and manageable down time. True capacity factor is the actual energy delivered to the customer over the lifetime of the unit minus any energy consumed by the supply minus any additional fossil fuels used to stabilize intermittent power divided by actual peak rated output. This will reduce the real capacity factors of Wind by about 50% or maybe even more than that. And Solar, depending on type and location probably by 20-30%. Wind Turbine efficiency drops with age. Blades develop cracks, get covered with dead bugs, dust, leaves and other debris and occasionally frost and ice. These effects all reduce real capacity factor. They also have significant downtime for maintenance, especially as they age. The grid often is unable to absorb Wind peaks, or Grid Operators may avoid accepting fluctuating Wind Energy for fear of de-stabilizing the Grid. These real world effects also reduce the True Capacity factor of Wind & Solar.
A major additional real reduction in Capacity Factor of Wind & Solar is their effect on backup power generation. Usually means using less efficient single cycle gas turbines than the combined cycle gas turbines, that would otherwise be used. Coal Power plants that have to be cycled to compensate for fluctuating Renewable Energy operate at much reduced efficiency and even have to burn imported Petroleum. Any additional use of fossil fuel required to stabilize the Power Grid and backup Renewable energy must logically be including in the Real Capacity Factor of a Renewable Energy power facility.
Solar Power facilities are also vulnerable to the vagaries of weather. There are large dust storms, in particular in desert regions, which coat collectors or panels with dust, greatly reducing capacity until maintenance people get around to cleaning them. Efficiency of Solar PV declines with age, it is maybe 20% less at 20 years. Insects, leaves and other debris will also lower the real world capacity factor. And of course due to the large area of Solar & Wind installations they are vulnerable to major downtime or total destruction due to Tornado’s, Hurricanes, Ice Storms, Earthquakes, Hail and Thunderstorms. Wind & Solar people like to ignore these effects for the few installations – for which “that will never happen”, but a correct calculation of Wind & Solar capacity factor must include a broad industry average for those effects over the lifetime of the installations.
For an excellent discussion see:
LESS FOR MORE: THE RUBE GOLDBERG NATURE OF INDUSTRIAL WIND DEVELOPMENT, by Jon Boone
Thank you for this post, as well as "The Future Cost of Renewables".
Jon Wellinghoff , chief of the Federal Energy Regulatory Authority, and his fellow Greens are, knowingly or unknowingly,perpetrating a fraud that will end up costing many millions of lives. His position is that we can maintain current levels of consumption and meet future increases in demand without ever building another nuclear or coal plant. This is a very scary and irresponsible statement for a policy chief to make, given what we know about the high costs and unreliable nature of solar and wind.
The costs of "renewables" is hidden by lies and subsidies, and when oil goes into steep depletion, we will find out that renewables will only replace a tiny fraction of power generated by nuclear and coal. And then it will be too late to reverse course, for the shortages of oil and gas will put the construction of new plants out of our price range.
Let's hope someone sets the Obama people straight on this before it's too late.
Post a Comment