
Environmentalists, despite the greenhouse gas dangers associated with natural gas often associated with natural gas often point to natural gas as a replacement for coal. Mark Cooper argues that among the market factors that could end the nuclear renaissance before it begins is
Falling natural gas prices that could stay low for decades, as new technologies have dramatically increased the amount of natural gas that is recoverable;Cooper claims,
Nuclear power simply cannot compete with low-cost natural gas. In a competitive marketplace, natural gas beats nuclear hands down from a price standpoint. This was a major factor in the collapse of the Calvert Cliffs-3 project in Maryland. Studies have shown that if built the South Texas Project - the next candidate in line for a federal loan guarantee - could not deliver electricity cheaply enough to survive. It is the key factor that has led many of the leading nuclear utilities in the U.S. to abandon plans for construction of new reactors.Cooper's claim rest on the argument that natural gas prices dropped significantly (by 47%) between 2008 and 2010, after a prolonged rise that saw natural gas prices rise by 400% between 1998 and 2008. Nothing in Cooper's text suggest that natural gas has entered in a decades long period of price stability, and there are reasons for being skeptical about Cooper's claim. Oil Drum commenter Art Berman (aeberman) noted,
Despite four decades of oil shocks and natural gas price spikes, the future looks stable with supply and demand comfortably balanced (Figure 2). Wasn’t it just two-and-a-half years ago that $147 per barrel oil helped push the world into the current global recession? The EIA forecast is as troubling for the smooth and gradual progression of oil and gas prices as it is for the improbably low values of those prices. The history of oil and gas price, supply and demand is characterized above all by volatility but the EIA projection does not reflect this characteristic. Don’t worry, be happy."Aeberman" offered an assessment of the claim that natural gas will be available long term at a low price in the Oil Duum:
Shale gas operators have consistently told investors that their projects are profitable at sub-$5/Mcf (thousand cubic feet) natural gas prices. Yet company 10-K SEC filings show that this is untrue. They have invented a new calculus of partial-cycle economics that excludes major capital draws for land costs, interest expense and overhead. They justify these disclosure practices because excluded costs are either sunk or fixed and, therefore, supposedly should not affect their decisions to drill. Their point-forward plans are made at shareholder expense since the dollars spent were very real at the time, and their costs cannot be charged to a profit center other than the wells that they drill and produce.Not only does "aeberman" raise doubt about the projected cost of natural gas, but he questions claims about the long term natural gas supply,
A multi-year evaluation of production costs for ten shale operators indicates a $7.00/Mcf average break-even cost for shale gas plays in the U.S. taking hedging into account (Figure 1). In other words, shale gas plays are not low-cost but comparable to conventional and other non-conventional projects. Despite claims to the contrary, the gas-price environment has been favorable over this period, in part because of hedging, and poor performance cannot be blamed on price. Over-production has changed this dynamic and hedging will not benefit operators in the second half of 2010 or in 2011, and possibly not for several years forward. This emerging trend will test the shale gas business model and show that it is unsustainable. The same ten companies that we evaluated have cumulative debt of more than $30 billion of which three have combined debt of more than $20 billion.
One Hundred Years of Natural Gas?"aeberman"asks, and the answers his own question,
Many people now believe that the United States has an abundant natural gas supply that will last for 100 years. While it is true that the resource base is large and that approximately one-third is from shale gas, it is not 100 years of supply at current consumption levels. The Potential Gas Committee’s (PGC) June 2009 report estimated that the U.S. has 1,836 Tcf of technically recoverable gas resources. Technically recoverable resources are different than commercially viable reserves. Nonetheless, a more careful reading of the PGC report reveals that the probable estimate is 441 Tcf and the shale gas component is about 150 Tcf (Figure 5). That resource represents a lot of gas but, at 23 Tcf of annual consumption, it is about seven years of supply, assuming that this was the only gas available. Based on production to date, it is likely that the commercial component of this resource is between 50 and 75 Tcf assuming a $7.00/Mcf gas price.
 But what about those maps that show shale gas plays extending over large areas?
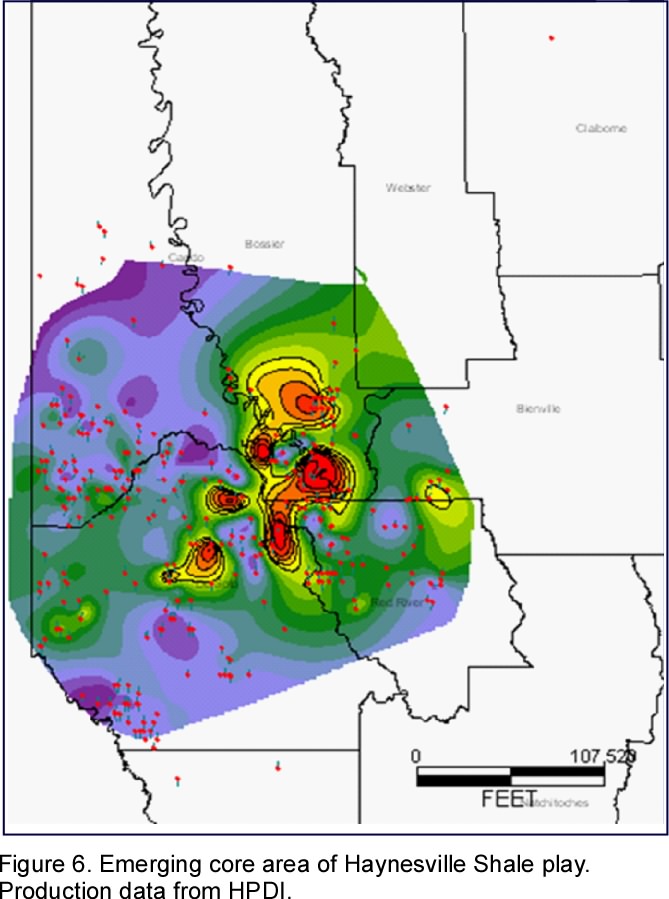
All shale plays contract to a core area or “sweet spot”. In the case of the Haynesville Shale, the emerging core area represents about 110,000 acres or 5 townships (Figure 6). This is a map of estimated ultimate recovery. The hotter red and yellow colors represent the emerging core area. This area is less than 10% of the total play area in Louisiana that was promoted several years ago as the largest gas field in North America and the fourth largest gas field in the world.The core areas of shale plays do not look nearly so grand. The Barnett shale gas play illustrates the problem,
high Barnett production volumes are unevenly distributed and many non-commercial wells have been drilled adjacent to excellent wells. The claim of repeatable and uniform results by the shale play promoters cannot be supported by case histories to date.Shale gas wells cannot be counted on as long term producers of natural gas,
The high shale gas reserve forecasts by operating companies are based on long individual well lives of as much as 65 years. In the Barnett Shale, wells were grouped by the year of completion and evaluated based on current monthly gas production. The percentage of wells from each group that are currently producing less than 1 million cubic feet of gas per month is shown in Figure 9. This gas volume only covers the cost of well compression assuming $5/Mcf without royalty payments or other costs. In other words, 25-35% of wells drilled over the past six or seven years are not paying for the cost of compression so what is the justification for 40-65 years of advertised commercial production?

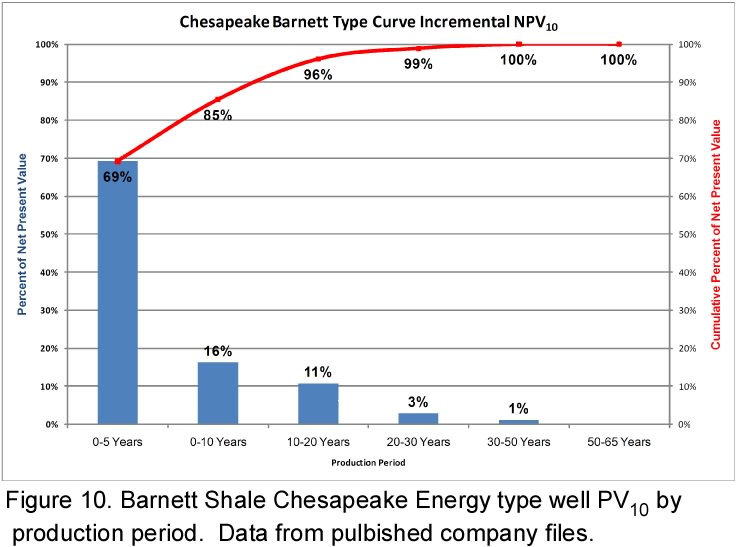
When we examined Chesapeake Energy’s type curve for the Barnett Shale and assumed that all parameters were correct--initial production rate, decline rate, well life, etc.--we found that most of the discounted net present value (NPV10) occured in the first five years and that there is negligible value after Year 20 (Figure 10). The type curve, however, forecasts about half of the reserves in years 20 through 65. Since these volumes have no discounted value, reserves are over-estimated by as much as 100 percent. There is clearly more risk in the shale plays than we are told.
 There is growing evidence that the Barnett Shale play is in decline. Drilling has declined, Chesapeake Energy has sold its stAke, and Texas endured a natural gas shortage during a January cold snap. the gas shortage lead to the shutdown of numerous gas fired generating plants as well as shortages of natural gas for heating by residential and comercial customers. The shutdown of Natural Gas fired power plants lead to wide scale rolling blackouts in Texas during the coldest day of the cold snap.
It should be noted that representatives of the natural gas industry did not dispute Berman's contentions, and Cooper has not addressed Berman's analysis. Thus Cooper's claim of a decades long abundant supply of low cost natural gas supply, appears to be questionable at best, as well as contrary to the historic trend in natural gas prices.
Secondly, Cooper's claim that Nuclear power cannot compete with the low cost of natural gas generated electricity not borm out by all analyses. The World Nuclear Association points to a 2010 mstudy by the OECD which found that the international cost of electricity generated by new natural gas facilities was higher than the cost of electricity generated by new NPPs. The WNA reported an electrical generating cost of 4.9 cents per kWh for new US NPPs in 2010, while the cost of electricity produced by natural gas CCGT ran to 7.7 cents per kWh during the same year. Cost estimates were based on a 5% interest rate. At 10% interest the cost of new NPP generated electricity rose to 7.7 cents, while the cost of new CCGT generated electrcity rose to 8.2 cents per kWh.
The WNA reported that several factors significantly impacted nuclear building costs.
These include,
* Building timeIt should be noted that Mark Cooper has simply ignored the WNA's contentions, even though they are based on data from the OECD/IEA. Cooper also fails to consider the effect of the various cost factors pointed to by the 2010 OECD/IEA report. The deliberate withholding of cost complexity data suggests that Cooper was deliberately cheery picking in order to contend that nuclear costs were far higher than may in fact be the case. Cooper appears to pick out the highest estimates of future nuclear costs, while ignoring lower estimates from credible sources, while deliberately ignoring evidence and choosing renewable cost estimates simply on the basis of their claimed lower than nuclear costs, rather than for the presentation of strong evidence.
* Years in operation
* Reactor size
* interest rate
* number of reactors built in a series
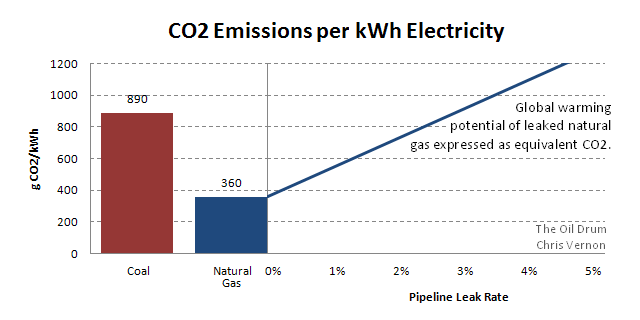
There is little doubt that a shift to natural gas will lower the emission of greenhouse gas in relationship to coal. Anthracite coal emits about 227 pounds of CO2 per million BTUs of heat, while natural gas emits 115 pounds of CO2 per million BTUs. in addition natural gas fired power plants operate with greater thermal efficiency. British estimates place Coal emissions at 890 Grams per kWh, while natural gas CO2 emissions are rated at 360 grams per kWh. Were CO2 the only greenhouse gas emission associated with natural gas use, the use of natural gas to mitigate the greenhouse effects of coal would be obvious. There are, as we will soon see, complexities which lead to uncertainty about the greenhouse mitigation benefits of natural gas use.
The World Socialist Web site recently took not of severalo recent accidents involving natural gas,
A natural gas explosion in Allentown, Pennsylvania, which killed five and damaged or destroyed scores of buildings last week, is just one of several such deadly incidents in the recent period.The story tells us that un the last few months the following accidents involving natural gas have occirred:,
The day after the explosion in the residential Allentown neighborhood, a massive explosion shook eastern Ohio’s Columbiana County. The blast site was in the rural town of Hanoverton. No one was injured, but the resulting fireball could be seen for miles around. Residents of Wilkshire Hills, some 25 miles away, reported seeing the flame.
Just two weeks before the fatal Allentown blast, on January 24, overpressurized gas pipes caused an explosion and fire that damaged close to 20 homes in Fairport Harbor, Ohio, near Cleveland, causing the evacuation of the entire village. While no one was injured in this particular incident, such events point to the enormous possibility for disaster in the gas pipeline infrastructure.
In another incident two days later, a house exploded in Horseheads, New York, in Chemung County, killing a toddler and injuring two others.
• September 9, 2010—San Bruno, California—8 deaths, 52 injuries, 50 homes destroyedThe wikipedia records the floowing Natural Gs pipeline accidents for the last decade,
• December 29, 2010—Wayne, Michigan—2 deaths, 3 injuries
• January 18, 2011—Philadelphia, Pennsylvania—1 death, 3 injured
• January 24, 2011—Fairport Harbor, Ohio—20 homes damaged
• January 26, 2011—Horseheads, New York—1 death, 2 injured, 1 home destroyed
• February 9—Allentown, Pennsylvania—5 deaths, 47 homes and properties damaged and destroyed
• February 10—Hanoverton, Ohio–brush fire
2000 A 30 inch diameter natural gas pipeline rupture and fire near Carlsbad, New Mexico killed 12 members of an extended Family camping over 600 feet (180 m) from the rupture point. The force of the rupture and the violent ignition of the escaping gas created a 51-foot-wide crater about 113 feet along the pipe. A 49-foot section of the pipe was ejected from the crater in three pieces measuring approximately 3 feet, 20 feet, and 26 feet in length. The largest piece of pipe was found about 287 feet northwest of the crater. The cause of the failure was determined to be severe internal corrosion of that pipeline. On July 26, 2007, a USDOJ Consent Decree was later entered into by the pipeline owner to do pipeline system upgrades to allow better internal pipeline inspections. (August 19, 2000)[179][180][181]
* 2000 For the second time in 24 hours, a state contractor building a noise wall along the I-475 in Toledo, Ohio struck an underground pipeline, and for a second time the contractor blamed faulty pipeline mapping for the accident. In this incident, the pipe was a six-inch gas pipeline. The crew was digging a hole with an auger for a noise-wall support on September 8, when it hit the underground pipe less than 500 meters from the previous day's incident.
* 2000 A Bulldozer ruptured a 12 inch diameter NGL pipeline on Rt. 36, south of Abilene, Texas, on September 7. A police detective, with 21 years of service, was killed. Nearby, a woman saved herself by going underwater in her swimming pool. Her house was destroyed by the explosion & fire.
* 2001 A 12-inch natural gas pipeline exploded in Weatherford, Texas on March 22. No one was injured, but the blast created a hole in the ground about 5 meters in diameter and the explosion was felt several miles away.
* 2001 On June 13, in Pensacola, Florida, at least ten persons were injured when two natural gas lines ruptured and exploded after a parking lot gave way beneath a cement truck at a car dealership. The blast sent chunks of concrete flying across a four-lane road, and several employees and customers at neighboring businesses were evacuated. About 25 cars at the dealership and 10 boats at a neighboring business were damaged or destroyed.
* 2001 At approximately 5:05 a.m. MST, on August 11, a 24 inch gas pipeline failed near Williams, Arizona, resulting in the release of natural gas. The natural gas continued to discharge for about an hour before igniting.
* 2002 On March 15, a failure occurred on a 36 inch gas pipeline near Crystal Falls, Michigan. The failure resulted in a release of gas, which did not ignite, that created a crater 30 feet deep, 30 feet wide, and 120 feet long. There were no deaths or injuries.
* 2002 On August 5, a natural gas pipeline exploded and caught fire west of Rt. 622, on Poca River Road near Lanham, West Virginia. Emergency workers evacuated three or four families. Kanawha and Putnam Counties in the area were requested Shelter-In-Place. Parts of the Pipeline were thrown hundreds of yards away, around, and across Poca River. The Fire was not contained for several hours because valves to shutdown line did not exist. The Orange Glow from the fire at 11 PM; could be seen for several miles.
* 2003 A natural gas pipeline ruptured near Viola, Illinois on February 2, resulting in the release of natural gas which ignited. A l6-foot long section of the pipe fractured into three sections, which were ejected to distances of about 300 yards from the failure site.
* 2003 On March 23, a 24 inch diameter gas pipeline near Eaton, Colorado exploded. The explosion sent flames 160 meters in the air and sent thousands of Weld County residents into a panic, but no one was injured. The heat from the flames melted the siding of two nearby homes and started many smaller grass fires.
* 2003 Excavation damage to a natural gas distribution line resulted in an explosion and fire in Wilmington, Delaware on July 2. A contractor hired by the city of Wilmington to replace sidewalk and curbing, dug into an unmarked natural gas service line with a backhoe. Although the service line did not leak where it was struck, the contact resulted in a break in the line inside the basement of a nearby building, where gas began to accumulate. A manager for the contractor said that he did not smell gas and therefore did not believe there was imminent danger and that he called an employee of the gas company and left a voice mail message. At approximately 1:44 p.m., an explosion destroyed two residences and damaged two others to the extent that they had to be demolished. Other nearby residences sustained some damage, and the residents on the block were displaced from their homes for about a week. Three contractor employees sustained serious injuries. Eleven additional people sustained minor injuries.[191]
* 2003 On 2 November, a Texas Eastern Transmission natural gas pipeline exploded in Bath County, Kentucky, about 1.5km south of a Duke Energy pumping station. A fire burned for about an hour before firefighters extinguished it. No one was injured and no property damage was reported.
* 2004 On August 21, a natural gas explosion destroyed a residence located at in DuBois, Pennsylvania. Two residents were killed in this accident. The NTSB determined that the probable cause of the leak, explosion, and fire was the fracture of a defective butt-fusion joint.
* 2004 On November 8, a NGL pipeline failed in a housing division in Ivel, Kentucky. The vapor cloud from the leak ignited, seriously burning a Kentucky State Trooper evacuating those living in the area. 8 others were injured and 5 homes were destroyed. The pipeline had 11 previous corrosion failures, and is only 65 miles (105 km) long.
* 2008 A natural gas pipeline explodes and catches fire on February 5, near Hartsville, Tennessee, believed to have been caused by a tornado hitting the facility.
* 2008 On February 15, a 20 inch gas pipeline exploded and burned in Hidalgo County, Texas, closing road FM490.
* 2008 A 36 inch gas pipeline fails near Stairtown, Texas on August 28, causing a fire with flames 400 feet (120 m) tall. The failure was caused by external corrosion.
* 2008 On August 29, a 24 inch gas transmission pipeline ruptured in Cooper County, Missouri. Corrosion had caused the pipeline to lose 75% of its wall thickness in the failure area.
* 2008 Workers constructing a new pipeline hit an existing natural gas pipeline in Wheeler County, Texas, on September 9.
* 2008 A 30 inch gas pipeline ruptured & gas ignited near Appomattox, Virginia on September 14. 2 homes were destroyed by the fire. External corrosion seems to be the cause of the failure.
* 2009 On February 1, a gas pipeline explosion rocked the area 2 miles (3.2 km) east of Carthage, Texas.
2009 Bushland, Texas — Two people were hurt when a natural gas pipeline exploded in the Texas Panhandle. The explosion early Thursday, 5 November, left a hole about 30 yards by 20 yards and close to 15 feet (4.6 m) deep. The blast shook homes, melted window blinds and shot flames hundreds of feet into the air. The home nearest the blast — about 100 yards away- was destroyed. Bushland is about 15 miles (24 km) west of Amarillo.
* 2010 On June 7, a 36 inch gas pipeline explosion and fire in Johnson County, Texas, was from workers installing poles for electrical lines. One worker killed, and six were injured. Confusion over the location and status of the construction work lead to the pipeline not being marked beforehand.
* 2010 On June 8, construction workers hit an unmarked 14 inch gas gathering pipeline near Darrouzett, Texas. Two workers were killed.
* 2010 A construction crew installing a gas pipeline in Roberts County, Texas hits an unmarked pipeline on August 25, seriously burning one man.
* 2010 On August 27, a LPG pipeline sprang a leak in Gilboa, New York, forcing the evacuation of 23 people.
* 2010 A repair crew was working on a corroded gas pipe in Cairo, Georgia on September 28, when the line exploded. One crew member was killed, and 3 others burned.
* 2010 A gas pipeline under construction in Grand Prairie, Texas was running a cleaning pig on October 15 without a pig "trap" at the end of the pipe. The 150 pound pig was expelled from the pipeline with enough force to fly 500 feet (150 m), and crash through the side of a house. No one was injured.
* 2010 A 30 inch gas pipeline fails at Natchitoches, Louisiana on November 30. There was no fire, but the pipeline had a Magnetic Flux smart pig test earlier in the year that indicated no flaws in the pipeline. The deadly 1965 gas pipeline accident occurred on a different pipeline owned by the same company nearby.
* 2010 On December 17, a gas line fire and explosion just outside of Corpus Christi, Texas city limits leaves one person critically injured. A man was working on removing an abandoned pipeline when it exploded, and the man's face was severely burned.
* 2010 A pipeline at an underground gas storage facility in Covington County, Mississippi on December 28, forcing the evacuation of about 2 dozen families for over a weekThis is by no means a comprehensive list. It fails to include the 2010 accident at the Kleen Energy Systems power station in Middletown, Connecticut, in whihj 6 people were killed and 27 injured. the power station was partially destroyed.
Clearly nartural gas leaks can be dangerous, but many leaks go undetected. Indybay.org reports:
Further threats include undetected leaks that could release small amounts of natural gas below ground over long time periods that could contaminate watersheds. Eventually the leaking methane would enter the atmosphere and contribute to global warming.
Many environmentalists concerned about climate change have often touted natural gas as an alternative to coal and oil. However, in the event of an undetected pipeline leak, escaped methane becomes a significant greenhouse gas twenty times worse than carbon dioxide . In natural gas pipeline leaks and small ruptures, if the pump pressure is not turned off, raw methane gas will escape until detected. Natural gas also escapes at well sites and from refineries. The yearly underestimate of escaping gas is approximately between 4-6 million tons. Over the last two centuries the atmospheric methane concentration has doubled, much of this likely a result of leaking natural gas pipelines.
The environmental safety record in producing regions and third world nations is not very good when compared to the developed regions that consume the gas. Generally speaking, the longer the pipeline, the more likely there will be leaks undetected for unknown time periods. Since the gas is invisible, natural gas pipeline leaks are more difficult to detect than pipelines leaking oil.
Probable risks of methane leakage, ruptures and explosions were understated in the EIS issued by El Paso Natural Gas Company. Explosions are caused by either internal or external forces causing the pipeline’s shell to rupture and leak methane quickly enough to combust the gas. Lack of repair and improper maintenance of pipelines by negligent pipeline corporations eventually leads to internal corrosion, a known cause of pipeline explosions.
 No one knows exactly how much natural gas is leaking into the atmosphere. However, methane the principle gas in natural gas, if a highly potent Greenhouse gas. Climate scientists use a rule of thumb that designates methane 21 times more portent than CO2. Thus even a small amount of methane leaking into the atmosphere could have serious climate implications. Thus the claims of anti-nuclear environmentalists such as Mark Cooper that natural gas is an effective tool for climate mitigation, has been meet by considerable skepticism recently.
Gail Tverberg of the Oil Drum has just offered an assessment of recent findings on methane emissions. She points to an Energy Collective post by David Lewis, titled "EPA confirms high Natural Gas leakage rates." Lewis argued that recent EPA research, and in particularly "GREENHOUSE GAS EMISSIONS REPORTING FROM THE PETROLEUM AND NATURAL GAS INDUSTRY: Background Technical Support Document," suggested a far higher natural gas leak rate than previously estimated. Lewis concludes,
in 2004 the GAO accepted the US gas industry line that leaks were lower than 1%, and looked out at the mayhem going on in the rest of the world (Russia announced it was not flaring at all even as NOAA satellite data proved they were doing "significant" flaring) and in comparison estimated world leakage at 3%. Maybe world data was actually beyond 6%. Why is 10% out of the question? This industry is using natural gas in areas where there is no electric grid as a power source, not by burning it, but as a substitute for compressed air.These conclusions are challenged in post comments by Geoffrey Styles,
In the US, past gas use must have been worse than coal and may even now be worse than coal. It may add up that the historic use of gas in the US to the present has been worse for the climate than if coal had been substituted all along, even if the climate impact is viewed over 100 years.
From what I read in your postings and comments, inflating the GWP for methane by 30% depends on the findings of one paper and is a matter currently under discussion by some in the IPCC, but not yet in the category of official policy and "settled science." Even so, for argument's sake let's take EPA's 261 MMt of CO2e and ratchet it up by 30% to 339 and add in the indirect and combustion CO2, to get 1339 MMt of CO2e for domestic gas's 20.4% of US energy consumption. Then we also have to up the impact of the methane emissions for coal, increasing its total to 2153 MMt for coal's 22.6% of US energy. That still leaves total CO2e emissions from gas 31% lower per BTU than those from coal. And note that this doesn't factor in the consumption side efficiencies of gas in the power applications that are the main focus of coal displacement, which has CCGTs at better than 50% efficiency, compared to coal in the mid-to-high 30s. No matter how you slice this, it still doesn't come up supporting your assertion that "gas is worse than coal".But is Styles estimate of the carbon equivalence of the natural gas leak rate is 30% to high, is the lower figure acceptable?
Robert W. Howarth has offered similar conclusions to those offered by Lewis,
We urge caution in viewing natural gas as good fuel choice for the future. Using the best available science, we conclude that natural gas is no better than coal and may in fact be worse than coal in terms of its greenhouse gas footprint when evaluated over the time course of the next several decades. Note that both the National Academy of Sciences and the Council of Scientific Society Presidents have urged great caution before proceeding with the development of diffuse natural gas from shale formations using unconventional technology.
Natural gas has been touted as a low carbon back up to wind generated electricity. Kent Hawkins, an electrical engineer, has challenged the carbon mitigation effectiveness of natural gas backed wind resources. Hawkins views have received further support from Australian Electrical Engineer Peter Lang, (see also here).
The pro-wind blog, Embracing My Planet, has challenged what it describes as Hawkins myths, (See Part I, Part II, Part III, and Part IV). However, the Embracing My Planet posts stop for short of refuting Hawkins detailed arguments. My own view is that there is not enough empirical research yet, to demonstrate that natural gas backed wind is an effective tool for carbon mitigation. Hawkins and Lang have established probable cause exists for skepticism, although they have not brought empirical proof beyond a reasonable doubt. Beyond that they have shown that wind advocates who have called for wind generation systems with natural gas backup, have not demonstrated that such systems are effective carbon mitigation tools. A great deal more research is needed before we can know with anything like certainty that gas backed wind is an effective and reliable tool for fighting global warming.
We must conclude that Mark Cooper's argument for long term low cost natural gas supplies as a low cost alternative to nuclear power is open to question, and the assumption that the use of natural gas generated electricity would offer substantual mitigation to AGW is questionable at best. our conclusion must be that natural gas is not an effective, low cost substitute for nuclear power, and thus nuclear power must be deployed if Anthropogenic Global Warming is to be controlled.


3 comments:
Actually Methane is 75% more potent in the first 25 years after release then decreases rapidly to hit the 25 times average.
Since we are most concerned about the next 25 years, the 75 times the number to be used not 25.
http://www.propublica.org/article/natural-gas-and-coal-pollution-gap-in-doubt
And even when methane in the atmosphere breaks down after that time, it degrades into CO2 which is, of course, a much longer lasting greenhouse gas. All the enthusiasm for natural gas might be understandable among climate change deniers, but they're being abetted by wind and solar advocates (misappropriately self-styled as "environmentalists") because they know damn well that their toys can't come close to providing reliable energy and need massive backup. Since they're generally also anti-nuclear, and want coal use to end, that basically leaves them with natural gas, so they jump into bed with T. Boone Pickens, forgetting that he was the same guy that financed the Swift Boat Veterans in 2004 that led to four more years of Bush the Lesser fiascos.
Good job on the article, Charles. Thanks.
Interesting resource page that has good material on fracking
http://peakoil.com/enviroment/propublicas-guide-to-fracking/
Post a Comment