Showing posts with label Wind costs. Show all posts

Thursday, June 9, 2011

Why Renewable Energy is so Expensive, While the Molten Salt Reactor is so Cheap

Sometimes the most important information comes from seemingly boring sources. Scholars are said to have the souls of ants because they look at seemingly boring material. But sometimes that boring material yields interesting and useful information that tells interesting stories. If interest is based on how much the story will effect the life of the reader or the life of every human being who lives on earth, then this story should be of considerable interest.

Vestas Wind Systems, is a Danish wind turbine manufacturer. In January 2011, Vestas published a report titled Life Cycle Assessment of Electricity Production from a V112 Turbine Wind Park. Within this report's boring and tedious pages are found some of the deepest secrets of the wind industry. "Life Cycle" contains a detailed account of the materials inputs for a 100 MW wind farm. The 100 MW is a nominal rating based on the use of 33 Vestas V112 wind generation systems in a theoretical facility. Each V112 is rated at 3 MW, although its actual output will varie from 0% to 100% depending on wind conditions. Average V112 output can also varie with location.

The report breaks down the materials input by component. Thus the wind turbine mechanisms and towers themselves will require 6634 metric tonnes of Unalloyed or Low alloyed steel and iron, 1442 tonnes of highly alloyed steel, and 2170 tonnes of cast iron. In addition the foundations will require 1491 Tonnes of Steel and iron materials, and 29770 tonnes of Concrete and mortar.

The wikipedia rates the average electrical output - the capacity factor - of wind generators from 20% to 40%. 20% of a 100 MW rated facility is 20 MWs while 40% is 40 MWs. Each V112 requires 355.7 tonnes of steel and iron to construct, or 117.7 tonnes per MW rated capacity. At a capacity factor of 40%, 293 tonnes of iron or steel input will produce one MW of average output, while at a capacity factor of 20%, 587 tonnes are required to produce a MW of average output.

In addition, about 300 tonnes of concrete is used for the tower foundation per every 1 MW of rated generating capacity. At 40% capacity factor that means 750 tonnes of concrete per average MW of output and at 20% capacity factor 1500 tonnes.

There are other significant material inputs into the V112 installation including Aluminum (total 208 tonnes per facility) and Copper (total 176 tons per facility).

Now lets look at another renewables technology, Solar PV. I looked at, A Review of Risks in the Solar Electric Life-Cycle, by V.M. Fthenakis and H.C. Kim of Brookhaven National Laboratory. Those writers reported drawing on date reported by Mason, J. M., V.M. Fthenakis, T. Hansen and H.C. Kim, in "Energy Pay-Back and Life Cycle CO2" Emissions of the BOS in an Optimized 3.5 MW PV Installation. Progress in Photovoltaics: Research and Applications, the report materials input for 1 MW on nominal PV generating capacity. These include 40 metric tonnes of steel per MW, 19 tones of Aluminum, 76 tons of concrete, 85 tonnes of glass, and 13 tons of silicon.

The Wikipedia reports capacity factors of from 12% to 19% for solar PV instalations. This would yield between 120 and 190 kWs of average output for every 1 MW of installed PV power. This would require an input of between 333 and 210 tonnes of steel and between 633 and 400 MT of Concrete per MW of average electrical output. The input of other material into the Solar PV instalation would be equally impressive.

Discussions of the future of energy should focus on costs and resource availability. Switching the world energy system from fossil fuels to post carbon energy technology will be a massive undertaking, that will require huge inputs of materials and labor, whatever energy technology is chosen. Yet the choice of technology is important because the cost of labor and materials inputs matters. Per Peterson illustrates the problem by a comparison of some material inputs for various nuclear technologies:
Image

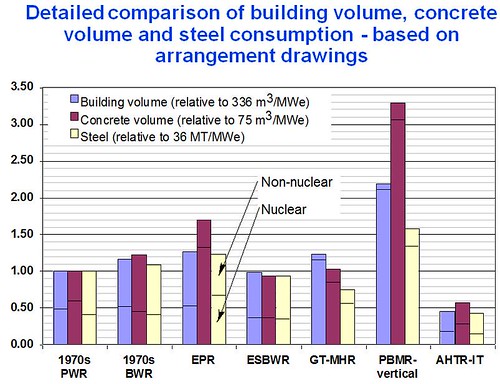
PBMR is a gas cooled Pebble Bed Modular Reactor while AHTR-IT refers to a molten salt cooled graphite moderated reactor that could use pebble bed technology. Peterson's graphic nicely demonstrates why Pebble Bed Technology, once viewed as very promising has ceased to be viewed as an important nuclear option. Yet pebble bed research has not been entirely wasted. Professor Peterson believes that all of the materials input problems of Pebble Bed Technology. AHTR-IT refers to molten salt cooled graphite moderated reactors that have similar featurs when compaired to MSRs.

In "Metal And Concrete Inputs For Several Nuclear Power Plants," Per F. Peterson, Haihua Zhao, and Robert Petroski of the University of California, Berkeley, reviewed the concrete and steel inputs requirements of several nuclear designs. They stated,
The construction of existing 1970-vintage U.S. nuclear power plants required 40 metric tons (MT) of steel and 90 cubic meters (m3) of concrete per average megawatt of electricity (MW(ave)) generating capacity, when operated at a capacity factor of 0.9 MW(ave)/MW(rated) . . .
Peterson and his associates stated that,
In nuclear energy systems, the major construction inputs are steel and concrete, which comprise over 95% of the total energy input into materials. To first order, the total building volume determines total concrete volume. The quantity of concrete also plays a very important role in deciding the plant overall cost:
• Concrete related material and construction cost is important in total cost (~25% of total plant cost for 1970’s PWRs [3]);
• Concrete volume affects construction time;
• Rebar (reinforcing steel in concrete) is a large percentage of total steel input (about 0.06 MT rebar per MT reinforced concrete for 1970’s PWRs [3]);
• Rebar is about 35% of total steel for 1970’s PWRs [3];
• Concrete volume affects decommissioning cost.
Peterson and associates explain the AHTR,
The AHTR is a new reactor concept that combines four technologies in a new way: coated particle nuclear fuels traditionally used for helium cooled reactors, Brayton power cycles, passive safety systems and plant designs from liquid cooled fast reactors, and low pressure molten salt coolants [14]. The new combination of technologies may enable the development of a large high efficiency, lower cost high temperature (700 to 1000oC) reactor for electricity. As the peak reactor coolant temperatures approach 700oC, several technologies (Brayton cycles, passive reactor safety systems, available materials, etc.) work together to improve total system performance while significantly reducing costs relative to those for other reactors.
Peterson estimates that the steel and iron input for a 1235 MWe AHTR facility to be around 19348 tonnes of metal with some where between 10% and 20% being non ferrous metals, or about 16 MTs per rated MW or 18 MTs per MW of average output. Concrete input would be 184354 cubic meters. Which comes to somewhere close to 424000 MT of concrete, or 343 MT per rated MWe, or around 380 MT of concrete per average MW of output.

The AHTR sufficiently similar to MSRs in design to argue that its material inputs would be similar to that of AHTRs. It should also be noted that Per Peterson and his associates did not consider this concrete and steel savings proposal. Namely that MSRs, be located in recycled coal fired generation facilities. We have no detailed studies of the benefits of the recycling approach would be, but if we assume a saving of 25% of ferrous metals and concrete. That leaves us with 285 MTs of concrete and around 13.5 tones of metal input per average MW of output.

At least one additional "trick" can be used to lower the materials input into MSR installations. The "trick" involves the use of underground housing of the reactor core. Above surface reactor installations require massive concrete and steel outer shielding structures, while such structures add no protection to an underground housed core, and thus are unneeded.

The AHTR derives its advantage from its materials advantage from its compactness. Peterson and his associates compared their AHTR design to the ESBRR, a generation III+ reactor. The ESBWR facility occupied 485477 cubic meters of building space compared to 184354 cubic meters for the AHTR. We can assume that the relationship will be similar for MSRs and ESBWRs.

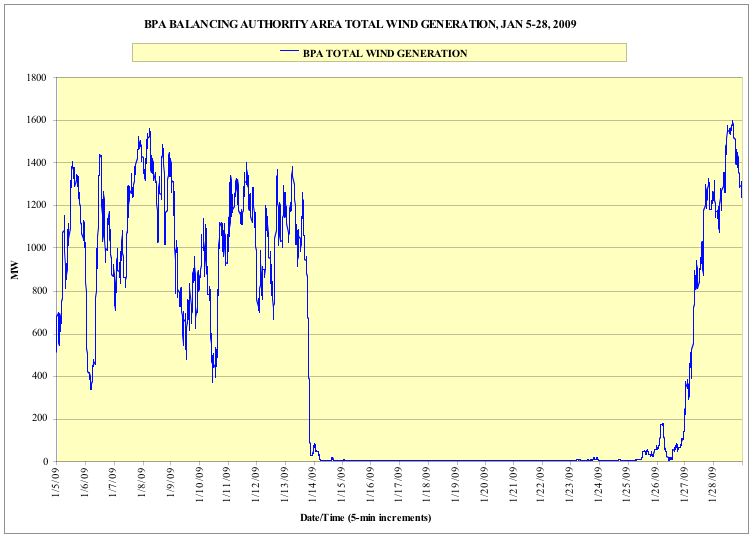
We began this story with an account of the materials inputs for Wind and solar PV installations. There is a flaw in that story as we have told it so far. Both Wind and Solar PV are variable and do not provide energy on demand. With such unreliable energy sources balancing from other energy sources. I recently noted that a recent IER publication Harnessing Variable Renewables: a Guide to the Balancing Challenge. A discussion of that publication in offshoreWIND.biz tells us,
The resulting analysis shows that each region has the technical resources to balance large shares of variable renewable energy.

Potentials range from 19% in the least flexible area assessed (Japan) to 63% in the most flexible area (Denmark). The IEA also assessed the resources of the British Isles (Great Britain and Ireland together), 31%; the Iberian Peninsula (Spain and Portugal together), 27%; Mexico, 29%; the Nordic Power Market (Denmark, Finland, Norway and Sweden), 48%; the Western Interconnection of the United States, 45%; and the area operated by the New Brunswick System Operator in Eastern Canada, 37%.
Most of the balancing resources will be carbon dependent. Thus the stable, reliable grid will continue to draw somewhere between half and two-thirds of its electricity from carbon emitting sources, if we exclude nuclear power. The only alternative to nuclear that will put us close to the carbon control 80% carbon reduction goal climate scientists say we need in order to prevent massive climate disruption, would be the the introduction of some form of energy storage. What ever form of energy storage will be chosen it will require materials input and will cost money, thus increasing the cost of renewables energy, without adding to energy output gain.

Thus the MSR and similar technologies represent reliable and low cost energy technologies, that should successfully compete with renewables on both reliability and cost. Our exciting conclusion to an otherwise dull story is that by potentially shifting to Molten Salt Nuclear technology, we can save the planet, while also saving a vast amount of money.

Tuesday, February 16, 2010

20% wind by 2030 not on track

Questions should be asked about the National Renewable Energy Laboratory relationship to the American Wind Energy Association's propaganda machine. The DoE report 20% Wind Energy by 2030: Increasing Wind Energy’s Contribution to U.S. Electricity Supply acknowledges the reports dependency on data supplied by the wind industry.
The U.S. Department of Energy would like to acknowledge the in-depth analysis and extensive research conducted by the National Renewable Energy Laboratory and the major contributions and manuscript reviews by the American Wind Energy Association and many wind industry organizations that contributed to the production of this report. The costs curves for energy supply options and the WinDS modeling assumptions were developed in cooperation with Black & Veatch.
Black & Veatch cannot be regarded as an objective source on wind. In fact Black & Veatch boasts,
We helped launch the modern wind power industry in 1975 . . .
Questions must be raised about the validity of this DoE's "20% by 2030" report. One test of the objectivity of a wind study is how well it deals with the inflation of wind costs. Since 2004 the costs of wind projects have risen more rapidly than the underlying inflation rate. Yet the report chose to assume base line inflation rates in its future cost projections. This can only be described as a major error. The report states:
Black & Veatch analysts (in consultation with AWEA industry experts) developed wind technology cost and performance projections for this report (Black & Veatch, forthcoming 2008). Costs for turbines, towers, foundations, installation, profit, and interconnection fees are included. Capital costs are based on an average installed capital cost of $1,775 per kilowatt (kW) in 2007. After adjusting for inflation and removing the construction financing charge, this reduces to $1,650/kW for 2006.
Lawrence Berkeley National Laboratory maintains a data base on wind costs. The LBNL report for 2008 titled 2008 Wind Technologies Market Report provides a empirical basis for evaluating the accuracy of the 20% wind estimates. The LBNL study states,
Among the sample of projects built in 2008, for example, the capacity-weighted average installed cost rose to $1,915/kW, up $190/kW (11%) from the weighted-average cost of installed projects in 2007 ($1,725/kW), and up $630/kW (49%) from the average cost of projects installed from 2001 through 2004. Project costs are clearly on the rise.
The LBNL report also found that the cost of wind turbines have been rapidly rising:
Since hitting a low point of roughly $700/kW in the 2000-2002 period, turbine prices appear to have increased by approximately $700/kW (100%), on average, through 2008. Between 2007 and 2008, capacity-weighted average turbine prices increased by roughly $90/kW (7%), from $1,270/kW to $1,360/kW.
A second appearant flaw in the "20% by 2030" report is its estimate of wind capacity. The report states:
Technology development is projected to reduce future capital costs by 10%.Black & Veatch used historical capacity factor data to create a logarithmic best-fit line, which is then applied to each wind power class to project future performance improvements
The report then projects rising wind capacity for dollar spent. But the the LBNL data in the hands of LBNL reporters tells a different story,
Despite this general improvement among more-recently built projects, the capacity-weighted- average 2008 capacity factor for projects installed in 2007 (35.0%) is down slightly from that for projects installed in 2006 (35.2%), which in turn is lower than for projects built in 2004-2005 (36.9%).
Thus not only are "20% by 2030" projected cost estimates likely to be quite low, projected capacity increases may be quite high as well, and in fact the observed trend toward lower capacity may continue into the future. The LBNL 2008 report states,
performance improvements appear to have leveled off in the most recent time period, however.
Thus "20% by 2030" cost estimates for wind are likely to be off by a wid margin to the down side.

The "20% by 2030" report states
Based on the assumptions used to create the 20% Wind Scenario, providing 20% of the nation’s projected electricity demand by 2030 would require the installation of 293.4 GW of wind technology (in addition to the 11.4 GW currently installed) for a cumulative installed capacity of 304.8 GW, generating nearly 1,200 terawatt-hours (TWh) annually.
Given the 2008 wind cost of $1915 per kW, the 20% goal would cost at least $550 billion, but this estimate is undoubtedly low, because it does not take inflation into account, and it assumes that 18% of the wind capacity would come from offshore, and offshore wind is considerably more expensive. The 20% by 2030 assumes a capacity factor of 40, and that is very ambitious. Realistically overly ambitions perhaps. At any rate that means that the average nuclear plant will produce 2.25 times as much electricity per unit of rated capacity as the average wind mill will. This gives us a figure of 4,3 billion 2006 US dollars for a wind array that would produce the equivalent amount of power to a 1 GW reactor. This figure would match the reactors cost, but the actual cost of wind would likely be higher, because the 18% offshore wind would be more expensive, the capacity factor of the 300 GWs of wind would probably be lower. Transmission system additions, required to accommodate wind would cost at the very least another $100 billion. It is quite clear that wind is not going to cost less than nuclear power, and according to EIA estimates future onshore and offshore wind will cost more.

Unfortunately then, the National Renewable Energy Laboratory appears to serve more as a front for the wind industry propaganda than as a source of reputable scientific research on renewable energy. For example, the NREL appears to not be researching carbon mitigation impact. But wind carbon mitigation can be inferred from NREL sponsored research, and it does not present a happy picture. Wind displaces carbon efficient closed cycle gas turbines before it displaces coal, and most or all of the displaced power in the 20% scheme is likely to come from the CCGTs, In contrast nuclear displaces coal rather than CCGTs, thus money spent on carbon mitigation with nuclear is 3.5 times more effective than the equivalent sum spent carbon mitigation with wind. This fact is carefully hidden by the "20% by 2030" report.

Wednesday, January 27, 2010

The cost of carbon mitigation with renewables

The National Renewables Energy Laboratory appears to be doing or sponsoring some decent quality research. inadvertently some of that research seems to undercut the case for renewable energy, or at the very least provide what should be a very sobering picture for renewables advocates. Last week I pointed to the Eastern Wind Integration and Transmission Study which appeared to demonstrate that the cost of electricity would rise as wind penetration increased on the Eastern Interconnect. Although the Western Wind and Solar Integration Study has not been completed yet, Some preliminary findings have been reported. I recently reviewed a preliminary study, How do Wind and Solar Power Affect Grid Operations: The Western Wind and Solar Integration Study, by D. Lew and M. Milligan of the National Renewable Energy Laboratory, and G. Jordan, L. Freeman, N. Miller, K. Clark, and R. Piwko GE. The WWSIS
examining the operational impact of up to 35% wind, photovoltaics, and concentrating solar power on the WestConnect grid in Arizona, Colorado, Nevada, New Mexico, and Wyoming.
I was particularly interested in the operational analysis, which was based on a computer simulation by GE. The simulation looked at 5 scenarios. In the first no wind was assumed and all electricity was generated by four generation sources, Nuclear, Coal, Combined cycle gas turbines, and hydroelectric generation. The second simulation assumed 11% renewables, 10% wind, and 1% solar. The third simulation assumed 20% wind and 3% solar, and the 4th simulation assumed 30% wind and 5% solar. Finally a simulation was run with the same 35% penetration, but using data from a week in July 2006, rather than the week in April 2006 assumed by the other studies. Peter Hawkins has argued that renewables penetration tends to displace Combined Cycles 'gas turbines, rather than coal fired steam plants, and that Open cycle Gas Turbines would be preferred to backup wind, because they would respond more quickly to sudden loss of generation or increased electrical demands. The GE simulations offer a chance to test Hawkins thesis, and the data suggests that indeed the GE simulations supported Hawkins hypothesis. At 11% penetration, only CCGT were displaced, but coal use was completely unaffected. At the 23% penetration level, most of the displacement effected CCGTs, but a small amount of coal displacement began to emerge. At the 35% penetration level for the week in April 2006, a considerable amount of coal generation was displaced, while CCGT use disappeared completely.. Finally the July 2006 simulation suggested that the summer wind problem was adversely impacting wind performance, at the same time electrical demand increased. The shortfall in wind performance had to be made up with CCGTs, and there was no coal displacement.

Estimates of CO2 emissions from CCGTs indicate that they produce about 0.8 pounds of CO2 per kWh of electricity generated. in contrast coal burning generators produce about 2 pounds of CO2 per kWh. Thus when CCGTs are displaced by renewables about 800 pounds or 0,4 tons of CO2 emissions are prevented per MW of electricity generated. When coal is displaced, about 1 ton of CO2 emissions are eliminated. Clearly then it is far more desirable from he viewpoint of carbon mitigation to displace coal burning plants, rather than CCGTs.

As with all National Renewables Energy Laboratory reports, the WWSIS made no attempt to compare renewables costs and performance with nuclear power. But a relatively simple thought experiment can yield some very telling results. First we can assume that nuclear power will displace coal rather than CCGT. The Energy Information Agency estimates that the levelized cost of Advanced Nuclear will be 119.0, or about 12 cents per kWh. If nuclear displaces coal at that cost, the cost of displacing one ton of CO2 would be $119. Now let us take the 11% renewables case. The 2016 levelized cost of wind is 149.3, while the levelized cost of solar thermal is 256.6. Thus the average levelized cost of the 11% renewables is 159.08, and the cost of displacing a ton of CO2 with renewables is $159.0 + transmission costs and other hidden cost of wind generation systems, and the added CO2 emissions of fossil fuel wind backups kept spinning. plus the added CO2 efficiencies of fossil fuel generators used in load leveling and load following roles. Since wind is displacing relatively carbon efficient CCGTs rather than carbon inefficient coal fired generating plants. each MW of CCGT power displaced would produce 800 pounds of CO2, rather than a ton of CO2 produced by the equivalent electrical output of a coal fired power plant. Thus carbon mitigation with the 11% wind April scenario will cost about $400 + hidden costs or over three times as much as nuclear power would costs.

In the April 35% penetration case, wind becomes the predominate source of electricity on most days, and it displaces 2/3rds of coal generation capacity and all the CCGTs. Yet for the July 35% penetration case, wind failed to displace most CCGTs and no coal. Thus the WWSIS study data reported provided in sufficient information for understanding the the potential carbon mitigation costs . However it should be noted that the DoE study, Eastern Wind Integration and Transmission Study(EWITS) found that the cost of total system electrical output increased
dramatically as wind penetration rose to 30%. (Note scenario 4 in figure 8,2)

Friday, January 22, 2010

EIA: 2016 Nuclear Costs will be Lower than Renewables.

The EIA has published its latest projection of 2016 new energy costs. Little has changed since the revised estimate published in April 2009. Once again the EIA believes that conventional nuclear power is the lowest price energy option. Anti-nuclear propagandist often mention the high price of nuclear as a reason for rejecting the nuclear option, but the EIA's estimates peg the cost of nuclear, though admittedly high, as substantially lower than the cost of onshore wind, and much lower than the cost of offshore wind, Solar PV, and solar thermal. Energy costs inflation appears to be still with us and the EIA estimates have increased the cost of nuclear, and onshore wind. the estimated costs of Solar Thermal and offshore wind have dropped from the 2009 estimate, but both are still far more expensive than nuclear. In addition the EIA cost estimates do not include he hidden costs associated with renewables. The introduction yo the cost estimates states,
The duty cycle for intermittent renewable resources of wind and solar is not operator controlled, but dependent on the weather or solar cycle (that is, sunrise/sunset). The availability of wind or solar will not necessarily correspond to operator dispatched duty cycles and, as a result, their levelized costs are not directly comparable to those for other technologies (even where the average annual capacity factor may be similar). In addition, intermittent technologies do not provide the same contribution to system reliability as dispatched resources, and may require additional system investment (not shown) to achieve a desired level of reliability.
These investments would include large scale expansion of grid long range transmission infrastructure, energy storage facilities or natural gas fired generators, and redundant renewable generating capacity. Thus the levelized cost of solar and wind do not reflect the entire cost of generating electricity using renewable sources. Eastern Wind Integration and Transmission Study(EWITS) estimated that a 20% onshore wind penetration of the Eastern Interconnect would require a $93 billion grid expansion.
That report found that the annualized cost of electricity from a 20% penetrated grid would be about 10% higher than the low wind reference case. The EWITS also found that without the grid long distance transmission expansion, grid expenses would be even higher. Finally the study suggested that an aggressive attempt to expand the wind penetration to 30% which included the use of offshore wind, would increase grid annualized cost by nearly 30% above the reference case. Thus a greater grid penetration by wind lead to higher electrical costs. The added annualized cost for greater wind penetration occurred despite a considerable decline in fuel related costs associated with greater wind penetration.

The EIA estimates the total levelized cost of the common post-carbon electrical options to be,
Onshore Wind 149.3
Offshore Wind 191.1
Solar PV 396.1
Solar Thermal 256.6
Advanced Nuclear 119.0
[EIA+-+Estimated+Levelized+Cost+of+New+Generation.jpg]

Robert Zavadil on "The Eastern Wind Integration and Transmission Study"

How much will increasing wind penetration in the United States grid cost? Is increasing wind penetration really the low cost route to post-carbon electricity? Yesterday, I read with interest, Joe Romm's post titled, NREL study shows 20 percent wind possible by 2024 - Half a million jobs, 25% drop in utility carbon pollution for just 2 cents a day per household. The post was ostensibly a review of a DoE study, Eastern Wind Integration and Transmission Study(EWITS). Joe began his post with an account of a previous DoE report on the cost and consequences of a large scale wind buildup. 20% Wind Energy by 2030: Increasing Wind Energy’s Contribution to U.S. Electricity Supply.” Joe had uncritically accepted the conclusions of the earlier study, but I had some some questions about that earlier study, because it had not focused enough attention on the future inflation of wind construction costs. Plans to dramatically increase energy related construction should assume that their implementation can and probably would exert inflationary pressures on construction costs.

There is a policy issue here. Wind electrical generation receives significant subsidies from the tax payers, and these subsidies are justified by the claim that wind is an economically desirable post carbon electrical source. Wind supporters refer to the high capital costs of of nuclear power, but are the capital costs of wind really lower? The EWITS report did not really address that issue, but I noticed that the report had actually been prepared by EnerNex Corporation of Knoxville, Tennessee, which meant that I could speak to one of the reports authors with a local phone call, so i put on my intrepid reporter cap, and called Robert Zavadil of EnerNex, and asked him about comparisons of wind and nuclear costs. Robert dodged my question by answering that future nuclear costs are something of a mystery, but this is equally the case with the future cost of wind generation.

Thus we are not going to reach anything like a firm conclusion about he relative costs of wind and nuclear, but the EWITS report does contain a lot of hints. For example, the EWITS states,
The EWITS LOLE studies show that when the geographic diversity of the Eastern Interconnection is considered, the capacity credit could increase to 25%.
The lowest cost of the 4 wind scenarios which the EWITS considers envisions the construction of 225 billion watts of wind generation capacity for the Eastern Interconnect. This means that 225 billion watts of wind generation capacity can be expected to typically produce about 56 GWs of electrical output during periods of peak energy demand. About 61 GWs of nuclear capacity would produce the equivalent capacity credit. Thus to start to understand the relative costs of wind an nuclear we could begin by comparing the costs of 225 GWs of wind with the costs of 61 GWs of nuclear generation capacity.

Robert Zavadil acknowledged that the EWITS estimates of nuclear, on shore wind and offshore wind and offshore wind were all to low, although the nuclear estimate was probably about 70% lower than was actually the case, while the wind estimates were off by a far smaller margin. Even given this disparity, the cost of the equivalent wind capacity credit would still be 50% higher than the cost of that of nuclear. And in addition a stable wind entails an enlarged transmission system and
With approximately 22,697 miles of new EHV transmission lines, the transmission overlay for Scenario 1 has the highest estimated total cost at $93 billion (US$2009).
You can buy quite a few reactors for $93 billion, but of course you might also want to spend some of that on transmission system upgrades. Thus while we cannot get exact estimates of the relative costs of large scale future wind and nuclear grid penetration, the analysis presented by the EWITS is consistent with an additional 20% nuclear Eastern Interconnect penetration, rather than the equivalent wind penetration, having a lower costs.

Wednesday, December 16, 2009

The bad news about off shore wind cost

An estimated figure of 10 trillion dollars to be spent on AGW mitigation by 2030 is being talked about at the Copenhagen Climate change conference. Nicholas Stern, the Chief Economist of the World Bank, who has researched the cost of mitigation told The Sunday Telegraph,
we should be prudent with public finances, but if we were to ask future generations: would you rather have a desecrated earth or more debt, then the answer would be they would like to have more debt. You can get out of debt, but you can't get out of the other. It's one of the few cases where there's actually an argument for more borrowing. There's a logical justification to it.
I agree with Lord Stern's assessment, completely, but I wish to note, that the investment of 10 trillion dollars will not be the total cost of fighting AGW, and that if we are going to spend that much money, we should spend it on effective mitigation tools. In addition we should in our mitigation efforts also focus on improving the quality of life for the poorest 3/4ths of the world's population. This will require us to make wise investments.

Yet I do not see a passion for wise mitigation investments coming out of the Copenhagen conference, in fact very much the opposite seems to be the case. For example the New York Times carried a story about New Your city Mayor Bloomberg's flyover visit to the Danish Horn Rev 2 wind project. The Mayor is reported to have been very impressed, and called for the building of a similar facility off Long Island. Perhaps the Mayor was not well informed about the cost of electricity from the Horn Rev 2 facility. The facility costs 1 billion dollars and and has a rated capacity of 200 MWs of electricity. But its average output is only about a third of that, 34% to be exact. So one billion dollars gets you an average of 68.5 MWe of electrical output. Put another way, each watt of average electrical output from the Horn Rev 2 facility carries a capital costs $14.60.

Costs for thew German off shore Alpha Ventures wind farm suggests that German off shore wind is going to be extremely expensive as well. A year ago Der Spiegel reported that
German offshore Alpha Ventus is to cost €180 million ($282 million) to build -- nearly three times as much as a similar installation on land. . . . Maintenance . . . running makes up some 20 to 30 percent of total costs,
Alpha Ventures has a rated capacity of 60 MW, Now over a year later the total cost of the Alpha Ventures project is up too $357 million, or $5.95 per watt. The Germans appear to be guarding Alpha Ventures capacity factor as if the survival of Germany and of the German people were dependent on maintaining its secrecy. However we can infer from German statements about future German wind capacity factors that North Sea capacity factors, are on the south side of .40. Assuming a capacity factor of .40 we get an astonishing $15 per watt of real world average electrical output. The German Government has approved the building of as many as 2500 off shore windmills between now and 2030. But the German commitment to offshore wind may be wavering.

The United Kingdom expects to spend 100 billion pounds (around 160 billion dollars) by 2020 on 25 GWs of offshore wind schemes by 2020, according to the British Crown Estate's. That is $6.40 per name plate watt, but once we compute for capacity factor, it gets much more expensive, but even at $6.40 per watt, we are moving into the nuclear cost range. British offshore capacity factors estimates run from .20 to .40, but even if we take the top end of the range we get $16 investment dollars for every watt of output. But the cost of offshore wind doubled between 2003 and 2008, and we have no assurance that offshore wind cost will
not continue their rapid assent in the future, especially since there is a big push in Europe to build offshore wind facilities.

We also should note that the see environment is hard on machinery. We should note that the German Alpha Ventus project, maintenance is expected to run as high as 30% of the total cost of the project. In addition, the expected lifespan of offshore wind turbines runs to 25 years, but this is just a guess, and perhaps a very optimistic guess at that. The life expectancy of onshore windmills is around 16 years, based on actual experience, although manufacturers say they expect a 25 year life span. It is probably the case that offshore windmills will not survive as long as onshore windmills, 25 years may well be optimistic and is perhaps very optimistic. At any rate after a period of time generously estimated to be 25 years, windmills will have to be replaced, although presumably some of the investment, for example offshore electrical cables and the structural towers can be recycled. Perhaps the replacement would cost 50% or the original cost. The expenses would add very considerably to the long term cost of offshore wind.

“The reduction, due to the introduction of wind energy conversion systems, in the capacity of conventional plant needed to provide reliable supplies of electricity.”
The formula for calculating this suggests that if the British built 40 GWs of mainly off shore wind, they could retire 7 GW of fossil fuel generating capacity. Of course, if we replace those fossil fuel power plants with conventional reactors, we could do it with a one on one swap. Lets us assume that the reactors cost $8 billion, the cost of the 7 reactors would be $56 billion perhaps a fifth of the cost of the wind facilities. In addition the reactors will last for at least 60 years, verses a maximum of 25 years for the windmills, and the cost of maintaining the reactors would be far less as well. Question for the British politicians, "Which is the better deal for the British Electrical customers.

In addition David Milborrow notes
the effect of reducing the load factor on the remaining thermal plant, . . pushes up their generation costs.
At the beginning of this essay, I pointed to the importance of wise investment in AGW mitigation measures. I have in the course of this investigation uncovered evidence, based primarily on the European and particularly the European experience, that in terms of capacity factor and in terms of capacity credit, the cost of offshore wind is far higher than the cost of nuclear power. This is of course a case study and case studies in the United States though perhaps yielding somewhat different finding, are unlikely to yield different conclusions. My findings are entirely consistent with my over all contention that the cost of nuclear power is significantly lower than the cost of renewable generated electricity.

Saturday, November 21, 2009

My Energy Collective debate is finally winding down

My debate with Stephen Gloor, an Australian pro-renewables engineer, seems finally to be winding down. I have been very ably assisted by Bill Hannahan, Rod Adams, and Nathan Wilson. This morning I wrote the following comment:
Stephen, you have in our discussion nicely illustrated the case against renewables, while offering your defense of renewable power systems. When confronted with the limitations of wind, you offered redundant dispersed wind installations as a solution. When it was pointed out that wind dispersion still left gaps in wind electrical generation, you offered solar-wind redundancy as a solution. Against the case that solar and wind both fail over wide areas, you offered another redundancy, the CO2 emitting use of natural gas as a backup to the not always reliable renewables system you call for.. Your solution also requires an enormous and expensive expansion of the electrical transmission system. I have called attention to a statement by a electrical transmission systems expert that an all renewables generation system would require 75 thousand miles of new transmission lines for California alone, in order to make the system reliable. Your solution to almost any renewable reliability problem is to build further, redundant renewable facilities, and connect them up with hundreds of thousands of miles of transmission lines.

You claim that nuclear construction it too slow, but nuclear power with its superior reliability, and its potential to be located near consumers, is far far more easily scaled to meet carbon free energy requirements, and to fulfill consumer demands than renewables are.

You never once stop to count the cost of the multiple redundancies and grid expansion you advocate. When confronted with the fact that even with the huge investments in wind, solar and natural gas facilities, there still would be uncovered problems like summer peak demand, in areas like Texas. Your response was to call for even more huge investments in energy efficiency. Thus you like other renewables advocates never stop to count the cost of your solutions, you simply recite the claim that nuclear is too expensive, while ignoring the fact that the renewables system you advocate would be far more expensive. You argue that reactors cannot perform load following, despite the fact that nuclear load following is performed as a matter of course in the French electrical system. You reject the possibility that nuclear research and a new generation of nuclear technology might lower nuclear costs.

Conclusions from our debate:
1. Renewable advocates have failed to make a convincing case that wind plus natural gas "backups" actually saves significantly more CO2, than wind alone. Money spent on wind generators is not justified unless a strong case exists that they actually save CO2.
2. Wind generators seldom operate at full capacity. Redundant wind generators are required to equal the capacity factor of reactors.
3. Even with multiple generators, natural factors such as day and night influence wind output. To achieve high renewable penetration, wind generators require daytime solar back up. The solar backup is a second form of renewables redundancy. In order to insure the availability of solar generated electricity during all daylight hours, heat storage is required, Heat storage requires redundant gathering fields, in order to insure that enough heat is collected during limited daylight hours.
3. All forms of energy storage, if used with renewables, require redundant generating capacity to service them. In addition the storage-generator unit is a further redundant electrical generator.
4. Even with significant redundancies, a high renewables penetrated grid requires significant natural gas backup. Natural gas backups thus form a further redundancy.
5. Renewables seldom can be located close to energy customers. Transmitting electricity from renewables generating facilities to customers usually requires new and expensive transmission lines. The cost of those transmission lines are a hidden cost of a renewable generation system, Using renewables output from other regions as a backup to local renewables requires still more new transmission lines. These interregional transmission lines that would not be required by an all nuclear grid, are transmission redundancies required to support a renewable power system.
6. Construction of nuclear power plants use significantly fewer materials than the construction the construction of solar and wind facilities require. The United States must compete with growing Asian economies for construction materials, and the current trade balance places the United States at a significant and growing disadvantage in this competition. Hence the cost of power generation facilities construction can be expected to rise during the next 15 years, with the cost of renewables rising more than the cost of nuclear power. The rise in materials cost, will also effect the cost of transmission lines, and this will effect the cost of an all renewables system far more than the cost of an all nuclear system.
7. Renewables advocates when confronted by the limitations of renewable energy and its high cost, fall back on a further redundancy, and that is efficiency. Efficiency advocates point to potential energy efficiencies, but seldom attempt to understand why these efficiencies are not already being adopted. Efficiency advocates often believe that naming an efficiency and describing it as a low hanging fruit is the same thing as demonstrating that it is a low cost alternative to building generation facilities. This is not in fact the case.
8. Renewables critics of nuclear power never reference renewables cost and compare the total cost of an all renewables electrical system, with the cost of an all nuclear electrical system. But judging from the current cost of renewables generation facilities, their capacity factors, and the added cost of new transmission lines needed to bring renewable generated electricity to distant customers, and the likely inflation of the cost of materials, the total cost of an all renewables system is likely to be several times higher the cos of an all nuclear system.

Friday, November 20, 2009

2025 Economic Developments in China and India, and the Future of American Solar and Wind

Brian Wang has a very interesting post based on economic projections by Rio Tinto, the international mining outfit. Rio Tinto clearly wants to know about future metal demands in the global economy. Of course this is important for Rio Tinto to know since it takes both time and a lot of capital to develop a new mine, and an accurate future projections is a way to control investment risks. Rio Tinto's projections are most interesting because they foresee the most significant driving force in the world economy as the development of China. The development of India will be a second major world economic driver. The Rio Tinto projection focuses on the next 15 years, and foresees rapid advances for both Chinese and Indian economies, with dramatic increases in personal income and standards of living. From Rio Tinto's perspective, the most important aspect of this picture is the demand for metals, and Rio Tinto for sees dramatic increases in Chinese and Indian demand for copper, and by implication for iron (steel) and aluminum.

While it would be fascinating to speculate on the consequences of these developments on the peoples of China and the United States who will by 2025 find themselves in the middle of an energy crisis, brought on by a decline in the world supply of petroleum, and the certainty of Anthropogenic Global Warming. I am assuming that by 2025 reality will have caught up with the most confirmed AGW skeptic. What I am interested in is how the economic development of China and India will impact the American efforts to deal with this dual energy crisis.

The Rio Tinto model suggests that Asian demand for the raw materials for developed societies, such as copper, steel, aluminum and cement would increase, and by implication there will be a steady increase in the price of these commodities. It will be plausible then the price in American dollars for copper, steel, aluminum and cement will be much higher than it is now, and that the ability of the United States to compete for these commodities on the international market will be seriously compromised by the large American international debt, especially the debt to China.

The competitive disadvantage of the United States will adversely effect many of its options in dealing with the dual energy crisis, because the raw materials for building new energy producing resources will be subject to increasingly onerous dollar inflation of materials costs. These developments will preclude energy approaches that will require high levels materials inputs, and will favor energy sources that will use lower cost materials, or smaller material inputs. These factors would tend to favor nuclear energy over renewables for both obvious and hidden reasons. The obvious reason is that nuclear requires far less copper, steel, aluminum and cement by the kW of generating capacity than Wind and Solar generating facilities do. We can infer from Barry Brook's discussion in the previous link, that the material requirements for a large renewables development in the United States would make such a development unsustainable.

Renewable advocates seldom talk about costs, that is advocates with the exception of Ed Ring. Prior to the 2008 vote on California Proposition 7, which mandated that by 2025 50% of California power be produced by renewables. Ring observed:
There is nothing wrong with encouraging clean, renewable, domestically produced energy. But California’s proposition 7 “would, if approved, require California utilities to procure half of their power from renewable resources by 2025" . . .

since Californians by 2025 are going to be consuming about 1,000 gigawatt-hours per day, if proposition 7 is enacted, 500 gWh per day will have to come from wind and solar power.
Solar power, installed – not including transmission or storage infrastructure – costs about $7.0 million per megawatt of output; this equates to $7.0 billion per gigawatt. If this sounds expensive, it is, but to get a truly accurate price you have to also take into account yield. Even in sunny California, solar energy (in terms of full-sun-equivalent hours), can only be harvested on average for 4.5 hours per day, which means to get 500 gWh of solar generated electricity each day in California, you would need to install 111 gigawatts of solar arrays (500/4.5), which would cost $777 billion dollars.
Wind power, installed – is a better deal currently than solar – insofar as you can probably get costs down to around $2.5 million per megawatt of output, or $2.5 billion per gigawatt. But the yield figures are also not promising. In California there is widespread disagreement on the yield for wind power – credible estimates range from 10% (2.4 hours per day) to 25% (6.0 hours per day). Given the magnitude of what is being proposed, it would be prudent to project wind yields in California somewhere in the middle of this range, say 17.5%, or 4.2 hours per day. This means to get 500 gWh of wind generated electricity in California you would need to install 119 gigawatts of solar arrays (55/4.2), which would cost $297 billion dollars.
Ring added,
It is tempting, and not entirely implausible, to expect prices for solar power to drop significantly over the next several years. But given the cost of balance of plant and installation labor, it is unlikely solar electricity is going to get measurably cheaper than wind power no matter how inexpensive the actual collector materials become. Moreover, the costs for new transmission lines and grid upgrades, the costs for massive energy storage units (since the sun and wind are only producing power during small portions of the day), and the costs for land aquisition, permitting and fighting environmentalist lawsuits will be substantial. For these reasons, estimating the total cost for California to deliver 50% renewable electricity at $300 billion is probably the very best case, if not fantastically optimistic. This is $20 billion per year for the next 15 years. Readers are encouraged to critique these projections.

Ring, did not include the costr of materials inflations in his estimate of costs.

A second serious materials problem for the development of renewables is materials requirements for electrical transmissions systems necessitated by the remote locations and the necessity of generation backup associated with a renewable dominated grid. Electrical Engineer E.G. Preston, who "by profession" does
transmission studies for wind and solar clients.
Preston, who has a PhD in Electrical Engineering, has an very impressive resume, clearly qualifies as an expert on renewables transmission, that is someone who would be accepted as an expert witness in court cases involving renewable related electrical transmission. In addition Preston does not have an ax to grind. Thus what he has to say about renewables transmission systems deserves serious attention. commenting on the recent Jacobson-Delucchi Scientific American article, A path to sustainable energy by 2030", Preston states:
Because the wind and solar and water and geothermal projects are not in the locations of the existing power plants, new lines will be needed. Looking at the graph on page 63, and carefully measuring scales on the graph, I estimate that there is 40,000 MW of wind and 40,000 MW of centralized solar on that graph. . . That leaves us needing 80,000 MW of new wind solar and geothermal generation just to serve California. I think an estimate of 500 miles from wind and solar resources to major load centers is reasonable. A 500 kV transmission line is rated at about 2000 MW max power. But you don't want to operate it at that power level because the losses are too high and there is no reserve capacity in the line to handle the first contingency problem. Therefore I will estimate we will load the new 500 kV lines to about 1500 MW on average. So we have 80,000 MW of renewable sources widely scattered around the Western System (WECC) with each carrying 1500 MW so that we need roughly 50 new 500 kV lines of 500 miles each, for a total length of 25,000 miles.
Preston adds
The article assumes there is little solar power energy storage and it also assumes the wind be blowing at night. We know for sure that the solar power is not available at night so we are nearly totally dependent on wind for night time energy. You are going to ask about the geothermal energy. One geothermal project I recently worked on for determining the transmission access for looked like a good project until the geothermal energy extraction failed to work. Recently other geothermal projects have created human induced earthquakes. Geothermal energy seem less likely today than just a few years ago. So we are nearly totally dependent on wind energy for the nighttime CA energy as envisioned in the 100% renewables by 2030. If we plan for those few occurrences when there is no wind in the WECC system, we must interconnect WECC with the rest of the US so CA can draw power from other wind generators that do have wind (hopefully) outside the WECC area, such as the Texas coast and east of the rocky mountains where massive wind farms can be constructed. However we will need at least 40,000 MW of lines that I estimate will average 2000 miles in length. If we used 500 kV lines, we would need about 25 of these lines bridging from WECC to the US eastern grid and ERCOT and the total length would be about 50,000 miles.
Of course, the increased cost of materials will effect the cost of transmission lines as well.

Prestons estimate is far more parsimonious in its guess about the number of solar and wind installations require to meet California's electrical need, and given a system of the magnitude Ring foresaw to meet California's 2025 electrical needs, a far larger local transmission system would have been required. Given the nuclear power cost advantage of both China and India over the next 20 years, the energy future of the United States and indeed the economic future looks quite dismal without a major technological breakthrough.

Thursday, September 10, 2009

Barry Brook and Company Destroy the Case for Renewables


When I first got interested in energy related issues I encountered what amounted to the "Green" party line. That was that Renewables would soon be so cheap, and our energy use would be so efficient that electricity would be virtually given away. I began however, to find reliable sources of information. Sometimes that reliable source was a press release for a "renewables" project, a wind farm or solar array. Reliable information could include the cost of the project, although this almost never included transmission lines. The press release often included the rated output of the project. If it was a solar project, the press release might refer to the area the project covered. The press release got really interesting when it talked about the projects cost. I should say estimated cost, because I suspect that some of those projects I read about ended up costing more than the reported cost in the press release.

I began to analyze this information. I was interested in the answer to the question, how much would it cost to replace CO2 emitting fossil fuel in electrical generation with a post-carbon energy source. That is where I ran into the reliability problem. You cannot replace coal powered electrical plants with wind generated electricity if the coal mainly produces electricity in the day time, and the wind blows at night. It was explained to me by some renewable advocates that the day time coal could be replaced by solar generated electricity, while night time power would be supplied by wind. This sounded good, but that meant that you had to pay for at least two generation facilities in order to be assured round the clock energy production. That got to be a little expensive, but then I discovered that even with solar and wind generation facilities you might not always have electricity when you wanted or need it. So you needed electricity from other sources.

Surprisingly renewables advocates told me that those other sources would burn fossil fuels. But that did not satisfy me, because the point of my exercise was to discover how much it would cost to replace fossil fuels., not how much burning fossil fuels would cost as a crutch for the limitations of renewables.

Some renewabes advocates told me that energy from renewables could be put into storage, and drawn out when there was demand for electricity. How much would that cost, I wondered. So I checked on the cost of various storage plans, pumped storage, Large batteries and compressed air. it turned out that there were inefficiencies and sources of energy lost coupled with all of these, ad none of them came cheep. When I started calculating the cost, an interesting pattern emerged. In every case, renewables plus storage was more expensive than the highest estimated nuclear cost. Even when I made assumptions that were favorable to renewables, for example assuming that the cost of nuclear power would be subject to inflation, while the cost of renewables would not be, the cost always turned out to be higher for renewabes. When I assumed a level playing field, the cost of reliable renewables would strikingly higher than nuclear, so much so that no one in his or her right mind would support renewables.

Someone suggested to me that I look at Mark Z, Jacobson's base wind scheme. I read Jacobson's papers and realized that his promised base load output, was about 20% of the name tage output of his wind facilities. Thus in order to produce a promised base load capacity of 1 GW 80% of the time, wind producers would have to put up 5 GWs of wind generation capacity. But 5 GWs of wind capacity was more expensive than a 1 GW nuclear power plant. Once more a favored renewables scheme proved more expensive than nuclear. The problem was much worse than this, however. None of the renewables schemes was as reliable as nuclear was. Jacobson's base load wind delivered 79% of the time, while the average nuke delivered 92% of the time. What is more, at least part of the nukes down time would be for maintenance, and could be scheduled in advance. The Nuke clearly offered superior flexibility over renewables, the nuk would almost always deliver electricity on demand.

I recently discovered that Australian Climate Scientist Barry Brook was posting information on his blog Brave New Climate that resembled my studies and which came to similar conclusions. These studies, many of which were preformed in part or completely by people who had far more expertise than i have came to the same conclusions that I came too.

i regard Barry as a major figure in the carbon mitigation debate. Perhaps there is a little vanity in this assessment, In many respects Barry's thinking is similar to mine, however, we party company in one significant respect. Our views on preferred nuclear technology differ, and the clash has at times been rancorous. I will deal with the issues on another occasion. At present I want to focus on Barry's month long attack on renewables. On August 8, Barry posted on brave New Climate a discussion of a paper by Peter Lang. Barry describes Peter:
(Peter is a retired geologist and engineer with 40 years experience on a wide range of energy projects throughout the world, including managing energy R&D and providing policy advice for government and opposition. His experience includes: coal, oil, gas, hydro, geothermal, nuclear power plants, nuclear waste disposal, and a wide range of energy end use management projects)
The post was titled "Does wind power reduce carbon emissions?" The Lang paper offered the following statement:
A single 1000 MW nuclear plant (normally we would have four to eight reactors together in a single power station) would avoid 6.9 million tonnes of CO2 equivalent per year. Five hundred 2 MW wind turbines (total 1000 MW) would avoid 0.15 to 1.3 million tonnes per year – just 2 to 20% as much as the same amount of nuclear capacity. When we take into account that we could have up to 80% of our electricity supplied by nuclear (as France has), but only a few percent can be supplied by wind, we can see that nuclear can make a major contribution to cutting greenhouse emissions, but wind a negligible contribution and at much higher cost.
The discussion which followed contained over 150 comments. This post was followed by an august 13 post titled, Wind and carbon emissions – Peter Lang responds. Lang's second essay offered the following statement: I would argue that average capacity factor is not valid for determining the amount of back-
up generation capacity required. The total generation system must be able to provide peak power when there is no output from the wind turbines. When wind power is zero, or near zero, at the time of peak demand, we need sufficient conventional generator capacity to provide the peak demand. This is because electricity demand must be matched by supply at all times. In other words, wind power cannot displace much, if any, conventional generator capacity.
If wind doesn't reduce CO2 as much as nuclear does and cannot be counted on in periods of peak electrical demand, what good is it? One hundred eighty four comments followed.

This was followed by an August 16 Lang based post, Solar power realities – supply-demand, storage and costs. This time a Lang paper goes after solar power.

This paper provides a simple analysis of the capital cost of solar power and energy storage sufficient to meet the demand of Australia’s National Electricity Market. It also considers some of the environmental effects. It puts the figures in perspective. By looking at the limit position, the paper highlights the very high costs imposed by mandating and subsidising solar power. The minimum power output, not the peak or average, is the main factor governing solar power’s economic viability. The capital cost would be 25 times more than nuclear power. The least-cost solar option would require 400 times more land area and emit 20 times more CO2 than nuclear power.

Conclusions: solar power is uneconomic. Government mandates and subsidies hide the true cost of renewable energy but these additional costs must be carried by others.

Four hundred thirty six comments followed this post. The Lang paper on solar power was followed by an August 31 post,Solar thermal questions, this time based on a paper by University of NSW academic, Ted Trainer. The Trainer essay is an all out, no holds barred, take no prisoners assault on solar, and what sort of intellectual respectability is left to solar advocates after their thrashing at Trainer's hands is open to question. Trainer writes:

The heat storage capacity of solar thermal systems overcomes some of the intermittency problems that trouble wind and PV systems, such as the occurrence of night time. The standard provision will be 12 hour storage enabling continuous 24 hour electricity delivery. However examination of climate data reveals that even at the best sites sequences of 4 or more days without sunshine are not unusual. The best US sites often have 2 runs of 4 consecutive days of cloud in a winter month. (Davenport, 2008)

If 1000 MW(e) output was to be provided for four cloudy day from stored heat, some 290,000MWh of heat would have to be stored. Storage cost has been estimated at $(A)10/kWh(th) meaning that the required storage plant would cost more than $8 billion, or around twice the cost of a coal-fired plant plus fuel. However this refers to trough technology and it is likely that for the ammonia process costs would be higher.

Again we would be faced with the prospect of very high capital costs for a large amount of plant that would not be used most of the time, and would still be insufficient occasionally. There would also be the question of whether there would be enough solar radiation in winter to meet daily demand and also recharge a large storage sufficiently to cope with the next run off 4 cloudy days.

The Trainer essay and Barry's discussion drew 98 more comments. Finally on the 10th Barry followed up Lang's first solar essay, with Solar realities and transmission costs – addendum.
Basically Lang compares the cost of providing reliable power for Australia with Nuclear and solar power. Trainer had observed,
examination of climate data reveals that even at the best sites sequences of 4 or more days without sunshine are not unusual. The best US sites often have 2 runs of 4 consecutive days of cloud in a winter month. (Davenport, 2008).
Lang noted,
A loop through the midday images for each day of June, July and August 2009, shows that much of south east South Australia, Victoria, NSW and southern Queensland were cloud covered on June 1, 2, 21 and 25 to 28. July 3 to 6, 10, 11, 14. 16, 22 to 31 also had widespread cloud cover (26th was the worst), as did August 4, 9, 10, 21, 22.. This was not a a rigorous study.
Thus Lang was thus responding to this data by asking how much would it cost to provide electricity during cloudy winter days in Australia..

It is assumed that South East Australia would need a power reserve capable of providing electricity during the cloudy winter days. That reserve can be either provided by nuclear power plants or by solar systems with three days energy storage, that is capable of being transformed into electricity. Lang's conclusions can be summarized with the following table:
Discussion of the latest Lang post continues, but it is clear that Lang, Trainer and Brook have destroyed the case for renewables beyond redemption.

Wednesday, August 12, 2009

Wind on Brave New Climate

Barry Brook's blog "Brave New Climate" is one of the best climate/energy blogs. Barry is an Australian climate scientist who is generally clear thinking about climate/energy issues. Barry is a fan of the Integral Fast Reactor. I believe that the LFTR represents a safer, more flexible, lower cost technology that possesses enormous potential. Other than our sometimes raucous disagreement on most favored nuclear technology we seem to agree on most issues.

During the last few days Barry has conducted a debate on wind issues under the title "Does Wind Power Reduce Carbon Emissions?" Barry's position is derived from a study titled, "Cost and Quantity of Greenhouse Gas Emissions Avoided by Wind Generation," by Peter Lang. Lang is a retired engineer who has over 40 years experience on a wide range energy projects and issues, including managing energy R&D and providing policy
advice for government and opposition. The money quote from Lang states:
“These calculations suggest that wind generation saves little greenhouse gas emissions when the emissions from the back-up are taken into account.

Wind power, with emissions and cost of back-up generation properly attributed, avoids 0.058 to 0.09 t CO2-e/MWh compared with about 0.88 t CO2-e/MWh avoided by nuclear. The cost to avoid 1 tonne of CO2-e per MWh is $830 to $1149 with wind power compared with $22 with nuclear power. If the emissions and cost of back up generation are ignored then wind power avoids about 0.5 t CO2-e/MWh at a cost of about $134/t CO2-e avoided. Even if the costs of and emissions from back up generation are ignored, wind is still over six times more costly that nuclear as a way to avoid emissions.

A single 1000 MW nuclear plant (normally we would have four to eight reactors together in a single power station) would avoid 6.9 million tonnes of CO2 equivalent per year. Five hundred 2 MW wind turbines (total 1000 MW) would avoid 0.15 to 1.3 million tonnes per year – just 2 to 20% as much as the same amount of nuclear capacity. When we take into account that we could have up to 80% of our electricity supplied by nuclear (as France has), but only a few percent can be supplied by wind, we can see that nuclear can make a major contribution to cutting greenhouse emissions, but wind a negligible contribution and at much higher cost.“
Lang's conclusions are truly devistating to the argument that wind electrical generation represents a major solution to the problem of global warming.

In the course of the debate on Barry's blog, Mark Jacobson's work on base wind was touted. Barry responded:
Jacobson’s work on distributed wind and vehicle-to-grid backup have been savaged by Charles Barton at Nuclear Green. . . .

I’d be interested (sincerely!) in knowing where Barton is wrong.

Barry thus challenges wind defenders to answer my criticisms of the Archer-Jacobson wind system. There were a few feble attempts to answer my challenge, which mainly offered alteration to the Archer-Jsaconson rules. For example Fran Barlow suggested
Whatever Jacobson proposes it seems to me that the overbuild for wind need be no higher than the CF would imply for 100% of nameplate.

So assuming a CF of, say 35% (the starting point for feasibility IMO) the overbuild should be no more than 2.84 so that taken together the farm’s reticulated components produce the output almost all the time. Only on those occasions wherea) there was a: decline in output below the anticipated output

AND

b) demand implied the anticipated output

would redundant capacity be brought online. Ideally the sites in question would be highly predictable on 2 hours notice.

Order of call would be

a)demand management measures

and/or

b)pumped hydro/V2G

and/or

c)NG

Note that NG need not be a fossil fuel — waste biomass from ADs or syngas from CSP usaage are options
Barlow's analysis simply assumes that average wind speed over the entire 17 site array would be constant, and simply by multiplying the generating capacity by the inverse of the capacity factor would give you a reliable supply of electricity. The rub is of course that the average wind speed over the entire array is not constant. Thus more wind capacity replication than Barlow calculates is required to create the base load level of reliability.

My reading of Archer-Jacobson is of course influenced by the fact that their analysis was conducted for Southern Great Planes wind resources. The most likely time for there to be a wind problem would be during Summer days, during periods of peek power demand by Texas electrical consumers. Supplying these demands is very much a quality of life issue, and on very hot summer days, when wind generation can drop to an absolute minimum, a significant public health issue. Demand management would be an extreme measure in these situations. My critique of Jacobson on the rationality of a V2G system was part Brook's challenge, and Barlow cited the use of V2G technology without defending that technology against my critique. She also advocates pumped hydro, but fails to offer a convincing analysis of how pumped hydro would provide a low cost solution to the problem of summer winds on the Southern Great Planes. Finally Barlow falls back on hydro-carbon solution including natural gas. The Natural gas solution of course does what we are trying to avoid, that is adds to the atmospheric CO2 levels. The other Barlow solutions, "waste biomass from ADs or syngas from CSP usage," involve further replications and added expenses. Needless to say Barlow does not stop to ponder the questions that her solutions raise.

Barry Brook has generated a necessary conversation on the limitation of wind, a conversation that will need to be repeated over and over again during the next few years.

Sunday, February 8, 2009

Texas Wind Still More Expensive with CAES than Nuclear

When I presented my cost study of "reliable Texas wind using batteries, several of my critics complained that alternative energy storage systems, for example pump storage or Compressed Air Energy Storage (CAES) . My analysis of the cost of Pumped Storage indicates that the capitol costs were comprable to those of batteries once uncertainties were taken into account.

However, CAES does appear to lower the cost of energy storage, but at the cost of a considerable inefficiency in the use of wind generated electricity, CO2 emissions, and a surprising environmental issue. CAES increases the reliablity of wind generated electricity, but may not greatly increase the value of off peak hours generated electricity to the producer, despite the delivery of more hours of electricity during day time and peak demand hours. Even with its ability to deliver electricity at times when utilities pay for it at optimal rates, CAES systems appear to only bring a modest return to their owners. I will presently argue that CAES could be more profitable without its coupling with wind using an alternative post-carbon energy stratigy.

This assessment is based on "The Economic Impact of CAES on Wind in TX, OK, and NM," by Ridge Energy Storage & Grid Services L.P, for the Texas State Energy Conservation Office. in 2005 .

The Ridge Energy study focused on atwo alternative hypothertical projects invloving the use of CAES thenology coupled to several wind generating facilities in West Texas, Western oklahoma, and New Mexico. These facilities have some of the most reliable wind in the United states, with average capacitiy factors of around .40. In addition, wind generation does not take place symultaniously at all of these facilities, thus coupled together they produce electricity with greater reliability than their average capacity factor might suggest. The use of CAES would enable the ability to guarantee the dispatch of both base electricity, and 16 hour a day week day electricity. The use of CAES would enable wind producers to sell electricity produced at night at day time prices, but with some fairly significant inefficiencies.

A significan amount of heat energy is lost during the air storage of the operation that aas the air decompresses, it comes out of the ground at below 0 C (32 F). Moisture in the decompressed air condensed and freezes. The resulting ice would damage generation turbines, necissitating the heating of the ait by burning natural gas to melt the ice. 40% of the energy converted into electricity in conventional CAES systems comes from burning natural gas. Energy output of CAES systems is .80 of energy inputs. This suggests that there are considerable in efficiencies in the use of wind generated electricity by the wind CAES system, and that 30% of the electrical input is lost to system inefficiencies.

Ridge energy stimatrd that the capital cost of a CAES system would run @$765 per KW, an exceedingly modest sum, but one which should be examined. The capital cost for electricity produced by the Wind cAES system is in fact much higher. Last week I discussed recent wind costs as reported by Bryan Layland, a electrical systems engineer from New Zeeland. Some commenters rejected Leylands cost figures on the wholely irrational grounds that he was a global warming skeptic. Looked for cost figures for North American Wind projects, in order to evaluare Leyland's numbers, and found 4four projects costing between $2200 and $3200 per name plate wind KW. For the sake of simplifying the argument I will stipulate a cost for new West Texas wind of $2250 per name plate KW in 2009. Since the capacity factor of West Texas runs around .40, the adverage output West Texas wind producer can expect to pay $5625 produce KWs of electricity his windmill will average producing. Since only 70% of the electricity entering the CAES facility reaches the consumer, the wind producer must add 30% more capacity to compensate for the energy loss. Thus the price of the wind generated electry entering the CAES facility must compensate the wind producer for something like a $8000 capitol investment for every average KW sold to the CAES facility. When added to the $765 per KW Capital investment in the CAES facility, we get a very ugly picture, of the cost of wind generated electrity. but one which is still less than our battery based system, about which I made some slightly different stipulations, Since the 2008 cost oh nuclear power is somewher between $4000 and $5000 per KW (as opposed to an estimated $8000 to 12,000 figure during the middle of the next decade).

I would next like to turn to what might be considered a suprising consequence of the use of CAES technology, that is a radiation problem. The same problem also exists, largely unrecognized with all gas fired electrical generating systems. The origin of the problem comes from the more or less uniform pressence of U238 and Th-232 isotopes in more or less uniform amoumnts in crustal rocks. Both isotopes are slighltly radioactive, and as they breakdown through alpha partical radiation, they under go nuclear mutations that eventually leads to the production of radsio-active radon gas. Radon present in rocks is known to escape with natural gas, and wiyh other gases, trapped underground, Salt is known to be relatively impermniable to the transportation of radioisotopes. And there is no uranium or thorium in salt domes. Thus air drawn from sali caverns should not posae radiation danger, as long as the salt has not been evaculated to the rock walls of the cavern. However there would be some question of radon pollutionof stored air in natural caverns, or in mines. There is an even more significant radon danger in deep underground aquifers, which have also been proposed for CAES. Greens, of course, will not see the sligest danger from radon escaping through the operation of CASES fascilities even though they would see far less radon escaping from reactors as an extreme and very dangerous environmental hazard. Radiation is not radiation if it comes from "natural" sources in the Green propoganda. Of course green advocates of CAES technology, all of whom are total hypocrites on radiation issues, have totally ignored the radon problem with natural gas and with many proposed CAES systems.

It is possible to recover at least some of the waste hear usually lost to cavern walls in CAES storage. Compressed air can be run through heast exchanges, just like air from super chargers is sometimes run through intercoolers to cool it before it enters an engine. Heat storage systems using rocks, mineral oil, or molten salt would have to be fairly masive, and would add complexity to the CAES system. While they might lesson the amount of heat lost to cavern walls, heat storage systems do not repeal the second law of thermodynamics, and at least 25% of the energy used to compress the air, is still lost in the process. It is not at all clear that the added capital expense of heat capture and release systems would cost less than the cost of the added wind capacity necessitated by CAES inefficiency.

Finally, it ought to be noted that a potential day carbon free power system for producing day time power with CAES without windmills is possible. It seems to have escaped the notice of most CASE advocates that CAES casn be teamed with nuclear power plants in innovative ways. Since it is more economical to keep reactors running at full power all night, suplus electricity produced at night could be used to store compressed air. During the day, compressed air can be used to expand the reactors daytime power output by as much as 40%. The air does not have to be heated with natural gas. Indeed the compressed air can be heated from the reactors waste heat, killing two birds with one stone, and conserving the water used for daytime reactor cooling, and the use of compressed air in cooling the reactor, would creat significant water use savings, allowing reactors to run even during drought conditions.

Followers

Blog Archive

Some neat videos

Nuclear Advocacy Webring
Ring Owner: Nuclear is Our Future Site: Nuclear is Our Future
Free Site Ring from Bravenet Free Site Ring from Bravenet Free Site Ring from Bravenet Free Site Ring from Bravenet Free Site Ring from Bravenet
Get Your Free Web Ring
by Bravenet.com
Dr. Joe Bonometti speaking on thorium/LFTR technology at Georgia Tech David LeBlanc on LFTR/MSR technology Robert Hargraves on AIM High